Grafana Cloud
Grafana Cloud is a fully-managed observability platform that includes Grafana Tempo for distributed tracing. OpenRouter sends traces via the standard OTLP HTTP/JSON endpoint.
Step 1: Get your Grafana Cloud credentials
You’ll need three values from your Grafana Cloud portal:
- Base URL: Your Grafana Cloud OTLP endpoint (e.g.,
https://otlp-gateway-prod-us-west-0.grafana.net) - Instance ID: Your numeric Grafana Cloud instance ID (e.g.,
123456) - API Key: A Grafana Cloud API token with write permissions (starts with
glc_...)
Finding your OTLP endpoint
- Log in to your Grafana Cloud portal
- Navigate to Connections > Add new connection
- Search for OpenTelemetry (OTLP) and select it
- On the configuration page, you’ll find your OTLP endpoint URL
The base URL should be the OTLP gateway endpoint, not your main Grafana dashboard URL. The format is https://otlp-gateway-prod-{region}.grafana.net.
Finding your Instance ID
- Go to your Grafana Cloud account at
https://grafana.com/orgs/{your-org}/stacks - Select your stack
- Your Instance ID is the numeric value shown in the URL or on the stack details page
Creating an API token
- In Grafana Cloud, go to My Account > Access Policies
- Create a new access policy with
traces:writescope - Generate a token from this policy
- Copy the token (starts with
glc_...)
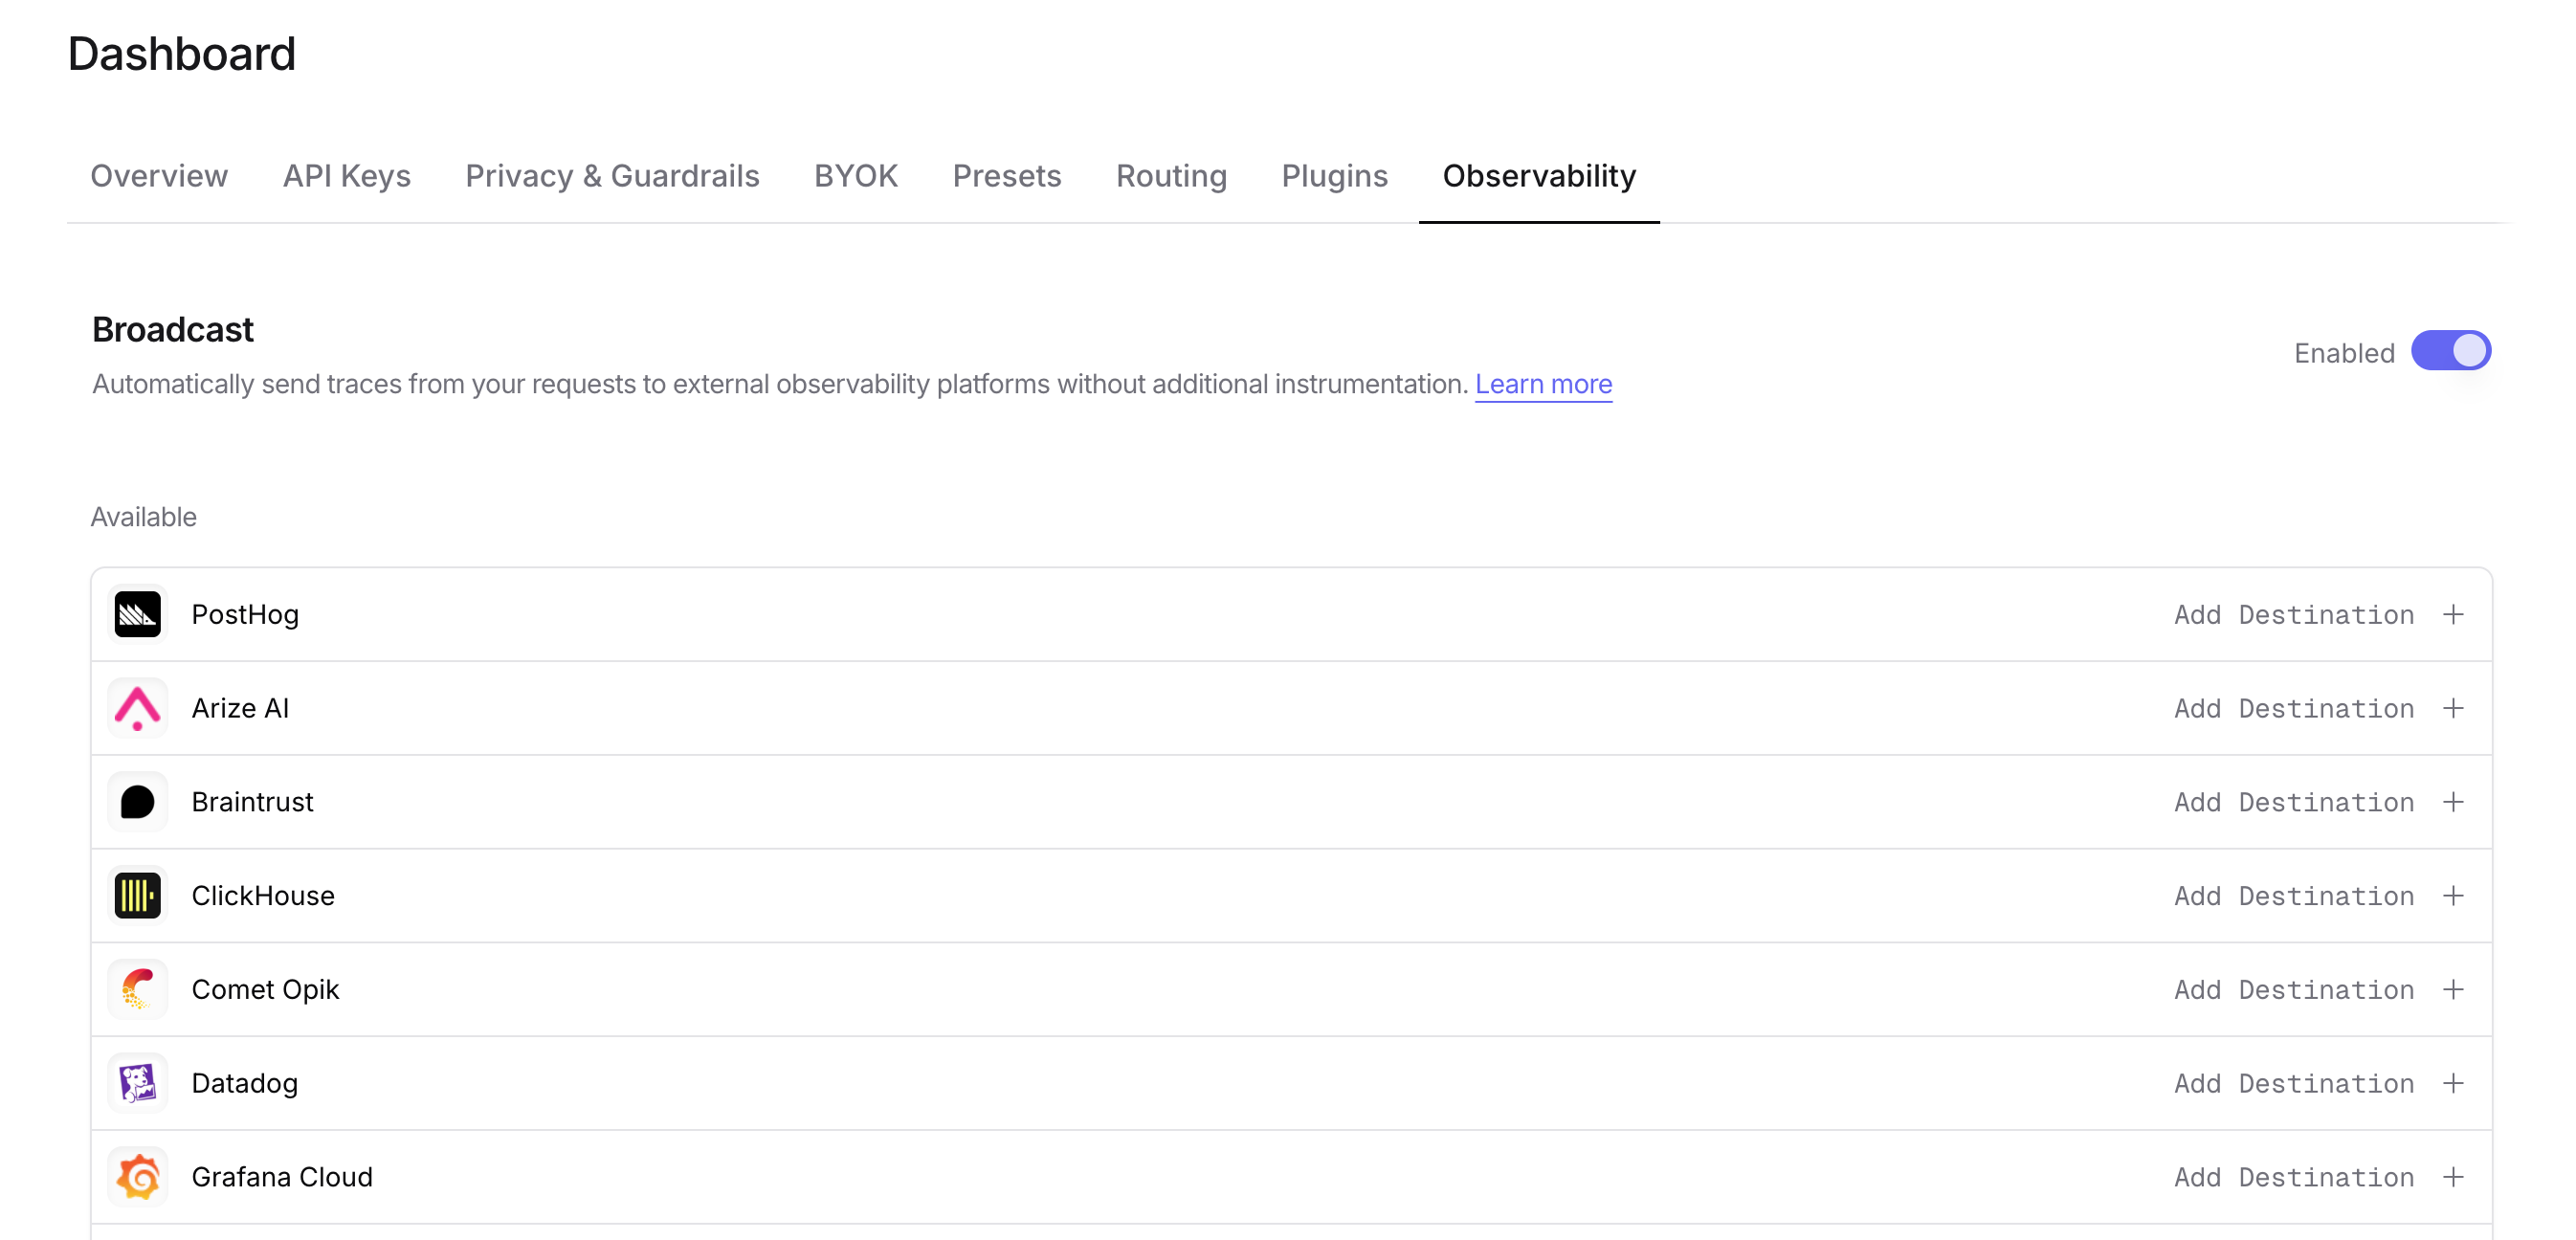
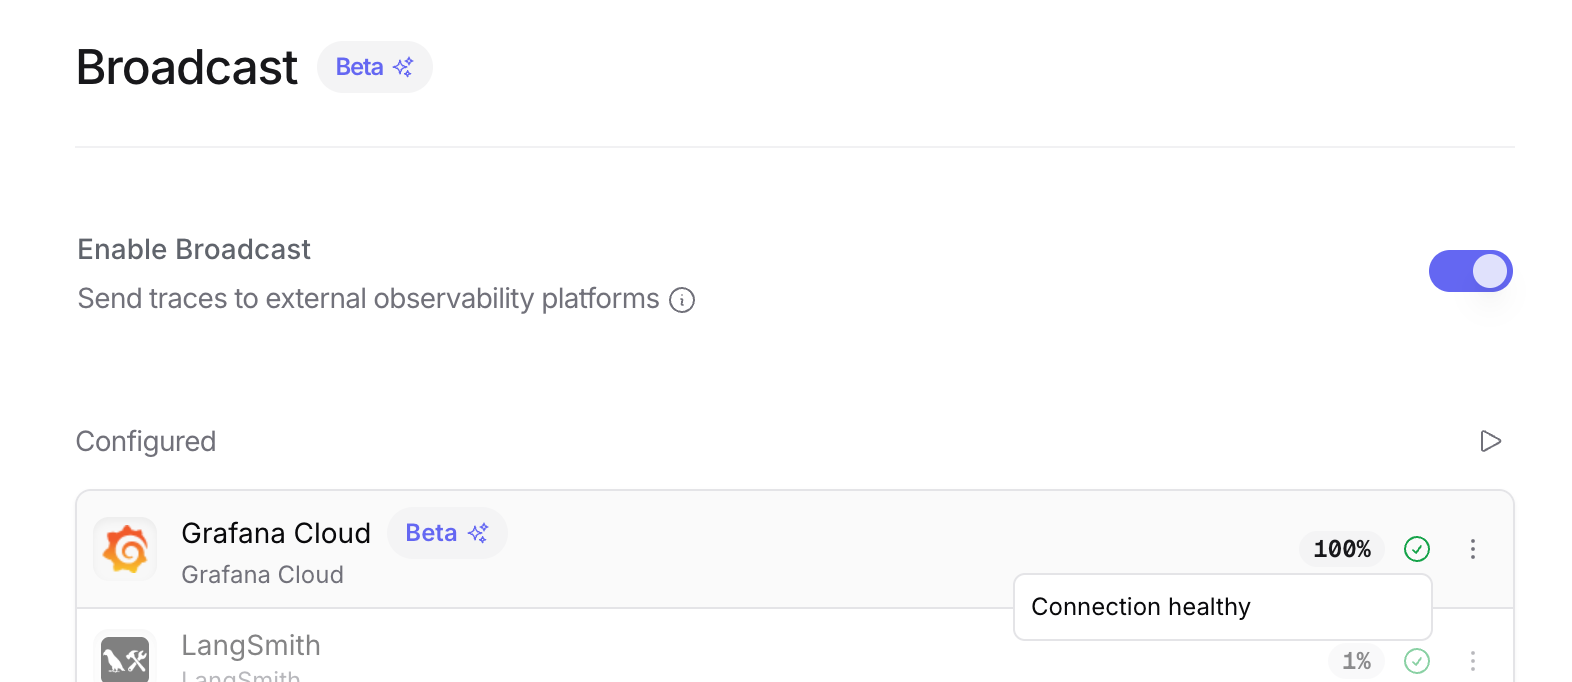
Step 2: Enable Broadcast in OpenRouter
Go to Settings > Observability and toggle Enable Broadcast.
Step 3: Configure Grafana Cloud
Click the edit icon next to Grafana Cloud and enter:
- Base URL: Your Grafana Cloud OTLP endpoint (e.g.,
https://otlp-gateway-prod-us-west-0.grafana.net) - Instance ID: Your numeric Grafana Cloud instance ID
- API Key: Your Grafana Cloud API token with write permissions
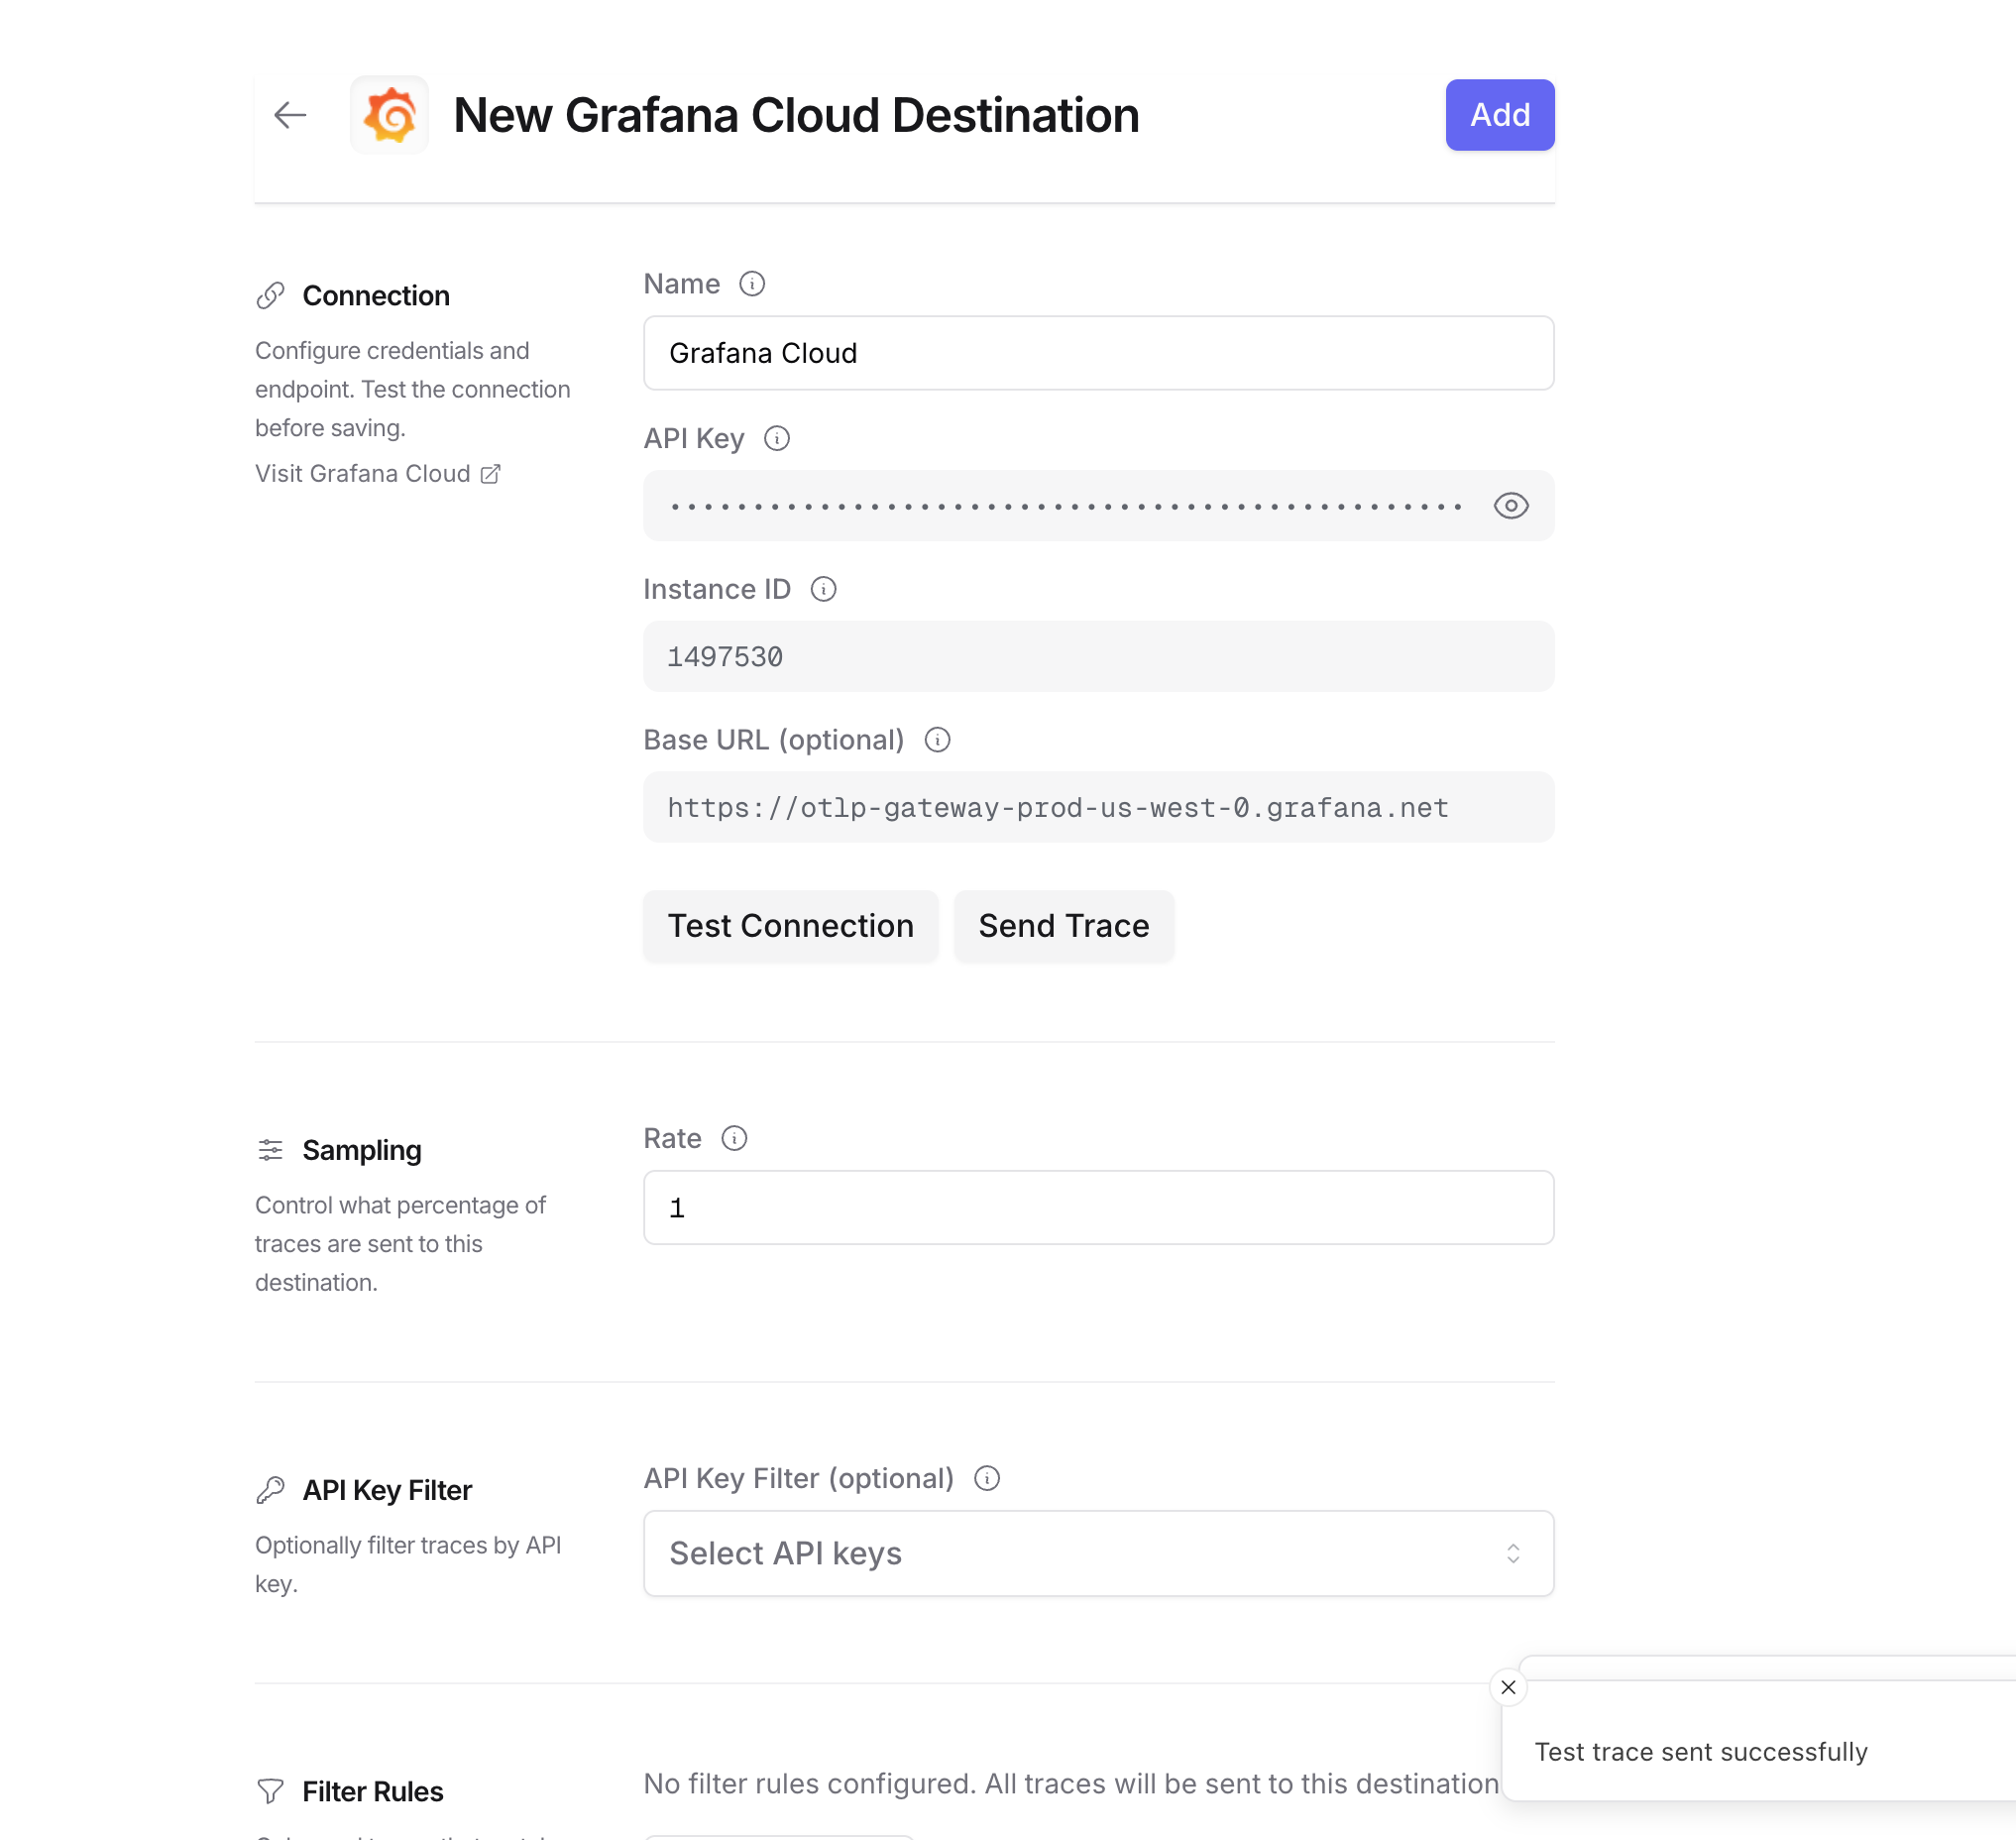
Step 4: Test and save
Click Test Connection to verify the setup. The configuration only saves if the test passes.
Step 5: Send a test trace
Make an API request through OpenRouter and view the trace in Grafana Cloud.
Viewing your traces
Once configured, you can view traces in Grafana Cloud in two ways:
Option 1: Explore with TraceQL
- Go to your Grafana Cloud instance (e.g.,
https://your-stack.grafana.net) - Click Explore in the left sidebar
- Select your Tempo data source (e.g.,
grafanacloud-*-traces) - Switch to the TraceQL tab
- Run this query to see all OpenRouter traces:
You can also filter by specific attributes:
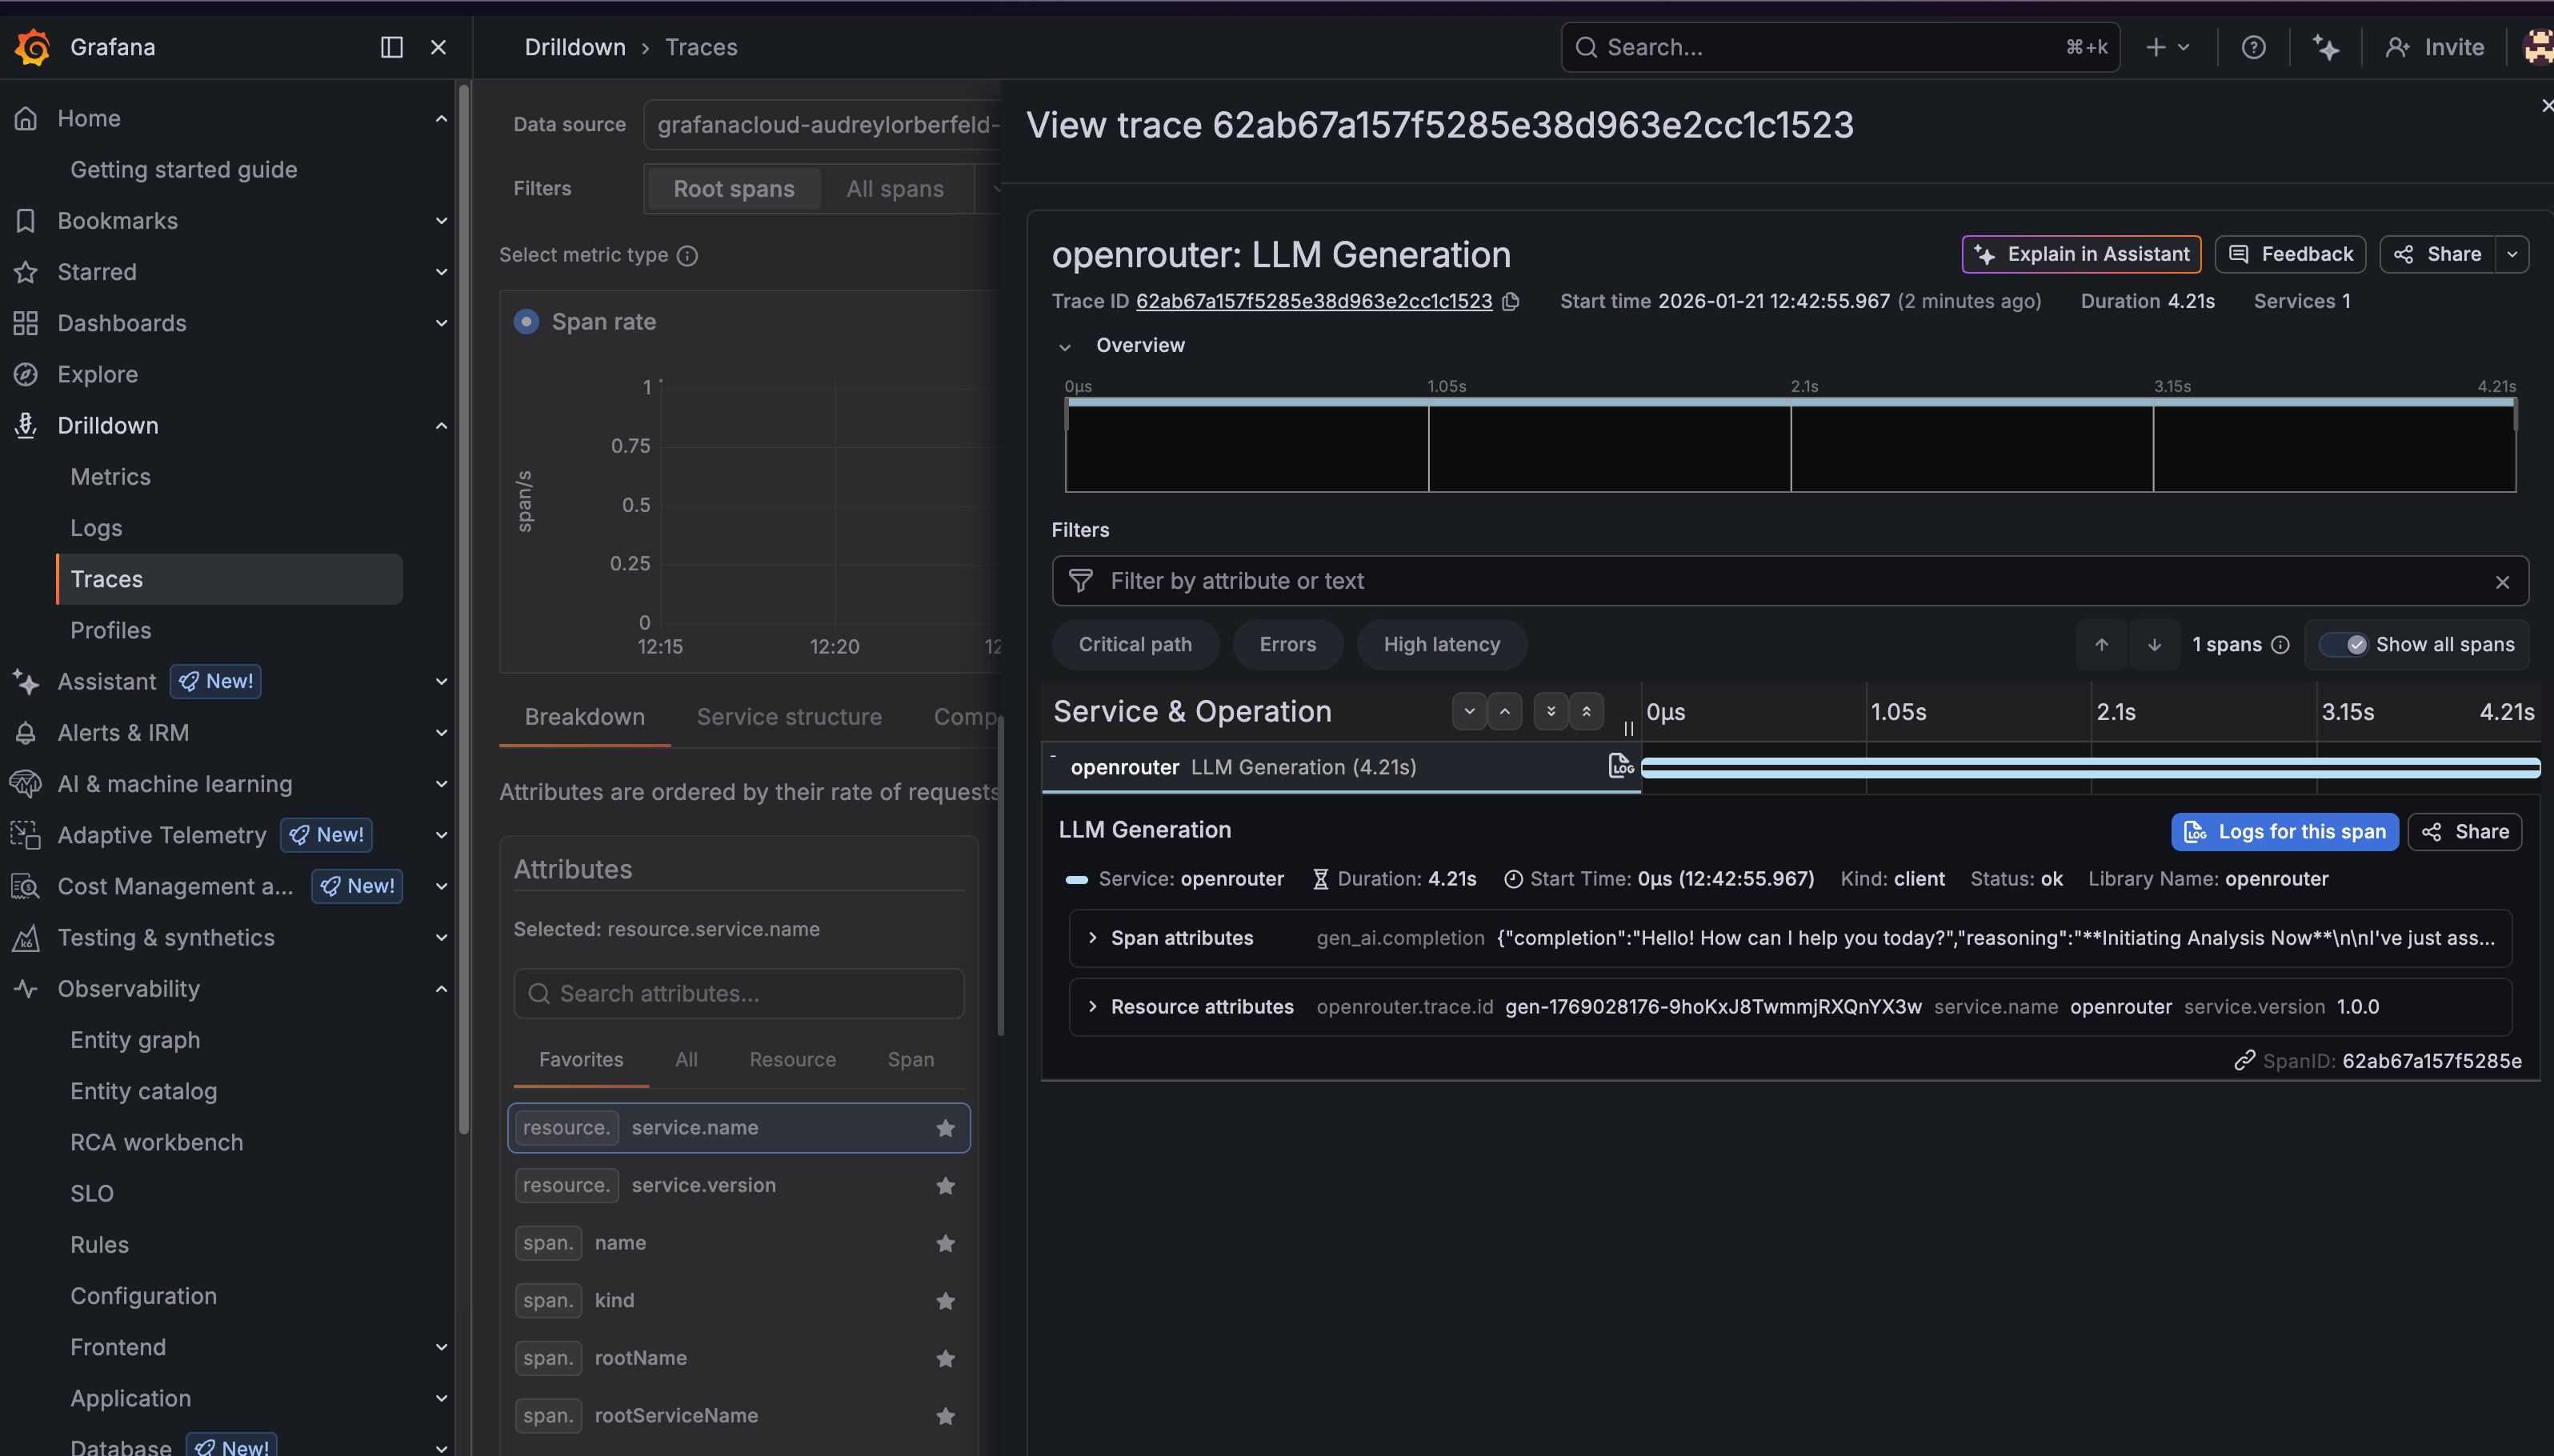
Option 2: Drilldown > Traces
- Go to your Grafana Cloud instance
- Navigate to Drilldown > Traces in the left sidebar
- Use the filters to find traces by service name, duration, or other attributes
- Click on any trace to see the full span breakdown
Trace attributes
OpenRouter traces include the following key attributes:
Resource attributes
service.name: Alwaysopenrouterservice.version:1.0.0openrouter.trace.id: The OpenRouter trace ID
Span attributes
gen_ai.operation.name: The operation type (e.g.,chat)gen_ai.system: The AI provider (e.g.,openai)gen_ai.request.model: The requested modelgen_ai.response.model: The actual model usedgen_ai.usage.input_tokens: Number of input tokensgen_ai.usage.output_tokens: Number of output tokensgen_ai.usage.total_tokens: Total tokens usedgen_ai.response.finish_reason: Why the generation ended (e.g.,stop)
Custom metadata
Any metadata you attach to your OpenRouter requests will appear under the trace.metadata.* namespace. See Custom Metadata below for details.
Custom Metadata
Grafana Cloud receives traces via the OTLP protocol. Custom metadata from the trace field is sent as span attributes and can be queried using TraceQL.
Supported Metadata Keys
Example
Querying Custom Metadata with TraceQL
Custom metadata keys are available as span attributes under trace.metadata.*:
Additional Context
- The
userfield maps touser.idin span attributes - The
session_idfield maps tosession.idin span attributes - Custom metadata keys from
traceappear under thetrace.metadata.*namespace in span attributes - You can create Grafana dashboards and alerts based on custom metadata attributes
Example TraceQL queries
Find slow requests (> 5 seconds)
Find requests by user
Find errors
Find requests by model
Troubleshooting
Traces not appearing
- Check the time range: Grafana’s time picker might not include your trace timestamp. Try expanding to “Last 1 hour” or “Last 24 hours”.
- Verify the endpoint: Make sure you’re using the OTLP gateway URL (
https://otlp-gateway-prod-{region}.grafana.net), not your main Grafana URL. - Check authentication: Ensure your Instance ID is numeric and your API key has write permissions.
- Wait a moment: There can be a 1-2 minute delay before traces appear in Grafana.
Wrong data source
If you don’t see any traces, make sure you’ve selected the correct Tempo data source in the Explore view. It’s typically named grafanacloud-{stack}-traces.
Additional resources
Privacy Mode
When Privacy Mode is enabled for this destination, prompt and completion content is excluded from traces. All other trace data — token usage, costs, timing, model information, and custom metadata — is still sent normally. See Privacy Mode for details.